
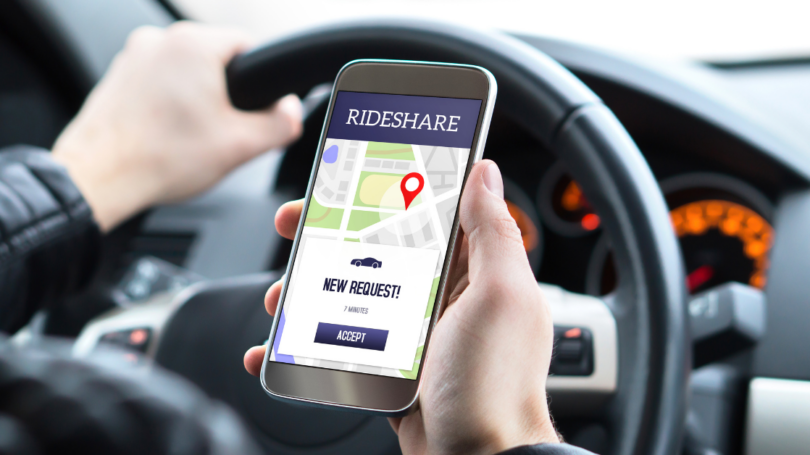
As ride-hailing regained momentum after the sharp slowdown in travel during the pandemic, city officials and transportation researchers have been left with a basic question that remains surprisingly hard to answer: Are rideshare-related crashes rising? While no comprehensive national data set currently exists, public reports and academic studies still offer insight into how rideshare activity and crash data have changed in several major cities.
The Government Accountability Office said in a 2024 report that ridesourcing services help meet transportation needs for many people in the United States, while also noting that policymakers and advocacy groups have raised persistent safety concerns around the industry.
To better understand what public records do show, Temple Injury Law, a personal injury law firm, reviewed government and academic sources on crash reporting, ride-hail activity, and urban traffic safety.
Research has linked ride-hailing growth to higher crash risk
Some of the strongest research suggests the safety issue is not limited to the passenger inside the car. A National Bureau of Economic Research working paper published in February 2020 linked the arrival of ride-hailing services in U.S. cities to a roughly 3% increase in traffic fatalities and fatal accidents from 2010 to 2016, affecting not only vehicle occupants but also pedestrians and cyclists.
The study also found ride-hailing growth was associated with more vehicle miles traveled, greater congestion, more traffic delay, higher gasoline consumption, and more new car registrations. Importantly, it did not find clear evidence that ride-hailing reduced drunk-driving-related fatal crashes enough to offset these risks.
New York’s local data show the limits of isolating rideshare crashes
New York City offers one of the most detailed public views into crashes involving for-hire vehicles, but its data do not provide a clean measure of Uber- and Lyft-specific crashes. The city’s Taxi and Limousine Commission publishes recurring crash data for TLC-licensed vehicles and separately regulates high-volume for-hire services, a category that includes companies such as Uber and Lyft.
That distinction is important when interpreting the city’s Local Law 31 crash reports. Those reports cover multiple classes of TLC-licensed vehicles, including black cars, liveries, taxis, and other for-hire vehicles, rather than identifying crashes involving Uber or Lyft alone. Black cars also should not be treated as synonymous with rideshare vehicles: The category includes both app-based and traditional black-car services.
The TLC recorded 3,967 crashes involving licensed vehicles in January 2019. Black cars accounted for 3,183 vehicles involved in crashes that month, compared with 803 in January 2024. Those figures span a period in which New York’s for-hire transportation market changed substantially, particularly during and after the COVID-19 pandemic.
As a result, the TLC figures are better understood as local context than as a direct measure of rideshare safety. They demonstrate both the scale of New York’s for-hire vehicle market and the difficulty of separating app-based rideshare crash trends from the broader universe of TLC-licensed vehicles.
Chicago’s data shows how quickly exposure grew
Chicago provides another useful, if incomplete, signal. A city report on public passenger vehicles said its analysis relied on Uber and Lyft data from the city study period. Earlier Chicago reporting found that vehicle miles traveled by transportation network providers with passengers increased by 344% from 2015 to 2018, underscoring how quickly exposure grew even before the pandemic era. In 2019, the city also said ride-hailing use had grown 271% in recent years.
While those figures do not amount to a city crash ranking, they show why large urban markets remain central to the debate over rideshare safety. More trips on the road, especially in congested corridors, can mean more opportunities for collisions, even if cities do not publish a clean yearly rideshare crash count. Still, the data highlights why cities with heavy rideshare activity remain central to ongoing traffic safety discussions, especially in dense urban corridors where pickup and drop-off traffic increased significantly after 2019.
Insights from cities highlight rideshare safety patterns
In a 2017 four-city analysis covering Las Vegas, Reno, Portland, and San Antonio, researchers examined weekly injury crashes around periods when Uber launched, stopped service, and later resumed operations. The results were mixed. Uber’s return was associated with fewer alcohol-involved injury crashes in Portland and San Antonio, but not in Reno. In Portland, the decline was especially sharp: Researchers estimated a 61.8% reduction, or about 3.1 fewer alcohol-involved injury crashes per week. But the same study found no evidence that Uber’s return reduced total injury crashes or serious crashes overall.
In New York City, a separate study using trip-level ride-hailing data pointed in the other direction for dense urban areas. Researchers found that each additional 100 rideshare trip origins within a taxi zone-hour was associated with 4.6% higher odds of any injury crash in that zone-hour. The association was found for motorist and pedestrian injury crashes, but not cyclist injury crashes.
However, what public data still cannot cleanly show is a definitive national leaderboard of post-2019 increases in rideshare crashes by city. The California Public Utilities Commission, for example, says public Transportation Network Company annual reports for 2021 to 2024 were suspended, and public 2014 to 2020 reports were delayed, leaving a major hole in one of the country’s most significant rideshare markets.
The broader traffic safety picture remains serious
The broader traffic backdrop also matters. The National Highway Traffic Safety Administration estimated that 39,345 people died in traffic crashes in 2024, down 3.8% from 2023 and marking the first year since 2020 that fatalities fell below 40,000. Even with that improvement, federal officials said the toll remains high, and the ongoing challenge for cities is understanding which modern traffic patterns (including curbside pickup activity, distracted driving, deadheading, and denser for-hire traffic) are adding risk in specific places.
Why stronger local reporting matters beyond city rankings
For now, the clearest takeaway is less about declaring a single “worst” city than about recognizing how uneven crash transparency still is. New York has one of the most visible public reporting systems. Chicago has released substantial ride-hail operating data. California has acknowledged major delays in public reporting. And across the country, researchers continue to find that ride-hailing’s safety effects are not uniform: it may reduce some alcohol-related crashes in certain markets while also increasing crash exposure in busy pickup and drop-off zones.
As more cities debate curb management, congestion policy, and traffic safety enforcement, the lack of local crash details may become harder to ignore. Without clearer public reporting, one of the country’s most common transportation habits will remain among the hardest traffic-safety trends to measure.

Jeff Temple focuses his practice in the area of personal injury. As a skilled personal injury attorney, he handles a broad range of cases including motor vehicle accidents, premises liability, and wrongful death. He is a graduate of the Radford University, he later attended the University of Miami School of Law and studied abroad at University College London. Upon graduating, Jeff relocated to Las Vegas and founded Temple Injury Law in 2022.

